
Build a data pipeline on AWS
I started this project in echo of the Kaggle competition related to PUBG, where the goal was to predict the player rank in the match based on some end of match statistics (like the distance ran during the match etc.). I wanted to understand the data source (to see if there are some intentionally missing stats/information) and try some services from Amazon like AWS Glue and Athena to build a data pipeline in AWS.
In this article, I will explain:
- What’s PUBG, the principle of the game etc
- The approach of the project
- The collection and the cleaning of the data
Description of PUBG
PUBG is one of the flagship games (first and one of the most popular) of a video game type called battle royale. The principle is that 100 players (more or less) are dropped on an island without equipment and they have to survive on this island by collecting materials, weapons, equipment and vehicles.
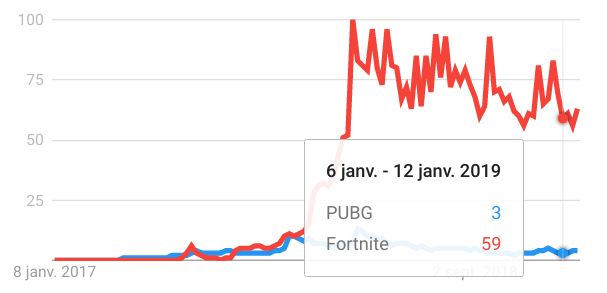
To push people to fight, the area available is becoming smaller as the game progresses so this format pushes people to fight each other because at the end there can be only one survivor. There are two very popular games that support the movement: PUBG and Fortnite. They are available on all possible platforms (PUBG on console is not good), and now you can see that all the other popular games (Call of Duty, Battlefield) want to add their own battle royale mode inside, but let’s be honest Fortnite is crushing everybody (check the Google Trends PUBG vs Fortnite).
My opinion on this kind of game is that the principle is cool, you can build some amazing situations where there is tension during the game but I think that you cannot sell (full price) a game that is just battle royale. Epic has been smart with Fortnite because they turned a project that took a long time to produce and whose sales were not good into something very lucrative by proposing a free standalone application that is using the same assets as the original game but only focuses on the battle royale (I hope that the guy who got the idea got a raise).
Let see the project of data collection.
Approach of the project
The idea behind this project is to:
Build a system to collect the data from the API delivered by the PUBG corporation
Clean the data
Make all the data available without downloading everything on my machine
To build the pipeline I decided to use AWS because I am more comfortable with their services than Microsoft, Google etc but I am sure that the same system can be built on these platforms too.
To complete the task, I decided to use the following services:
- EC2 instance to have a machine running to make the collection
- S3 to store the data collected and process
- Glue to make the data clean and available
- Athena to be the interface with the data store in S3
There is an high level view of the process deploy on AWS with the different steps.
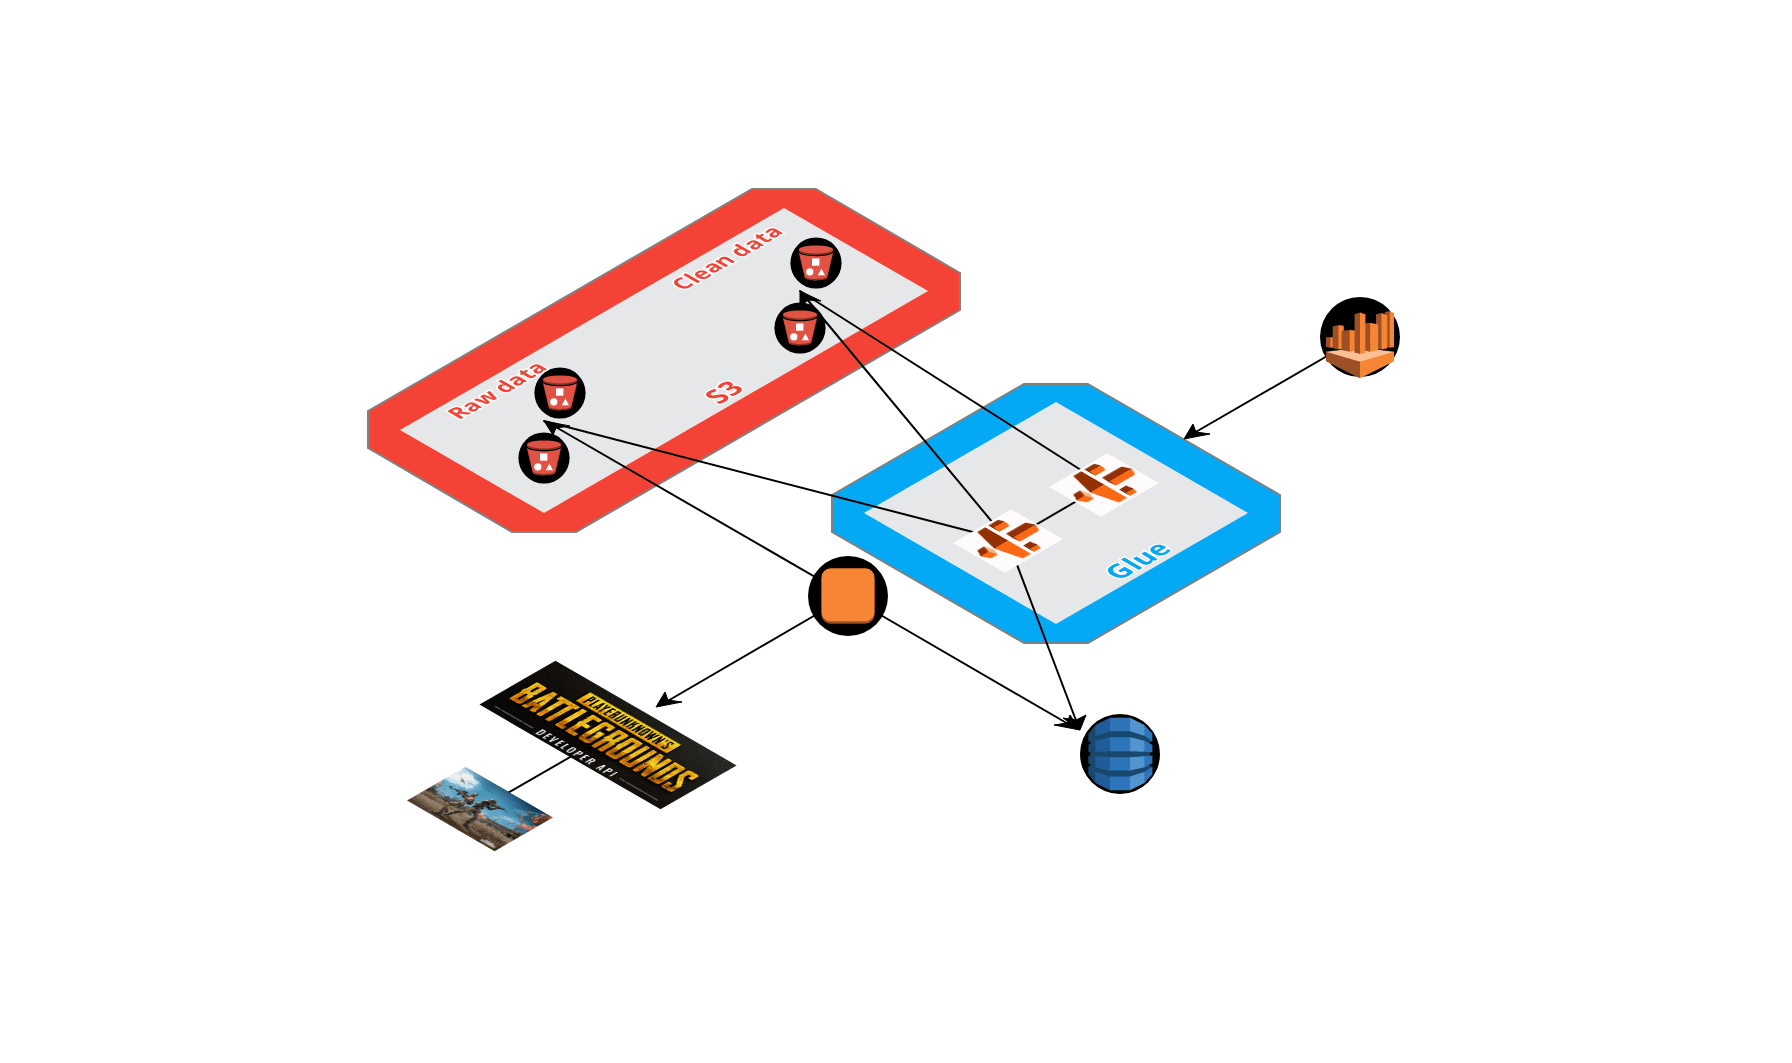
Let’s see the process in details.
Collect the data from PUBG API
The PUBG corporation has built a very good open API, there are multiple endpoints that open different data sources. To make it simple you can access data related to:
- The PUBG player defined by their account ID
- The match defined by their match ID
There is data from multiple platforms (PC, Xbox, and PS4) from different regions (America, Europe and Asia). For this article I am going to focus on the PC platform and the North America area. There are multiple endpoints on this API but let’s focus on:
- The sample endpoint: That gives access to some match IDs updated every day
- The matches endpoint: That gives details on the match, like the end result and more importantly the link to download a compressed packet of events.
You can find a repository with the functions that I built to collect, clean and send the data. This notebook gives good insights into the data collected. There are three types of data:
- The end match stats, they are stored in a “folder” in an S3 bucket
- The complete events that are stored in another folder
- The decomposed events that are stored in separate folders
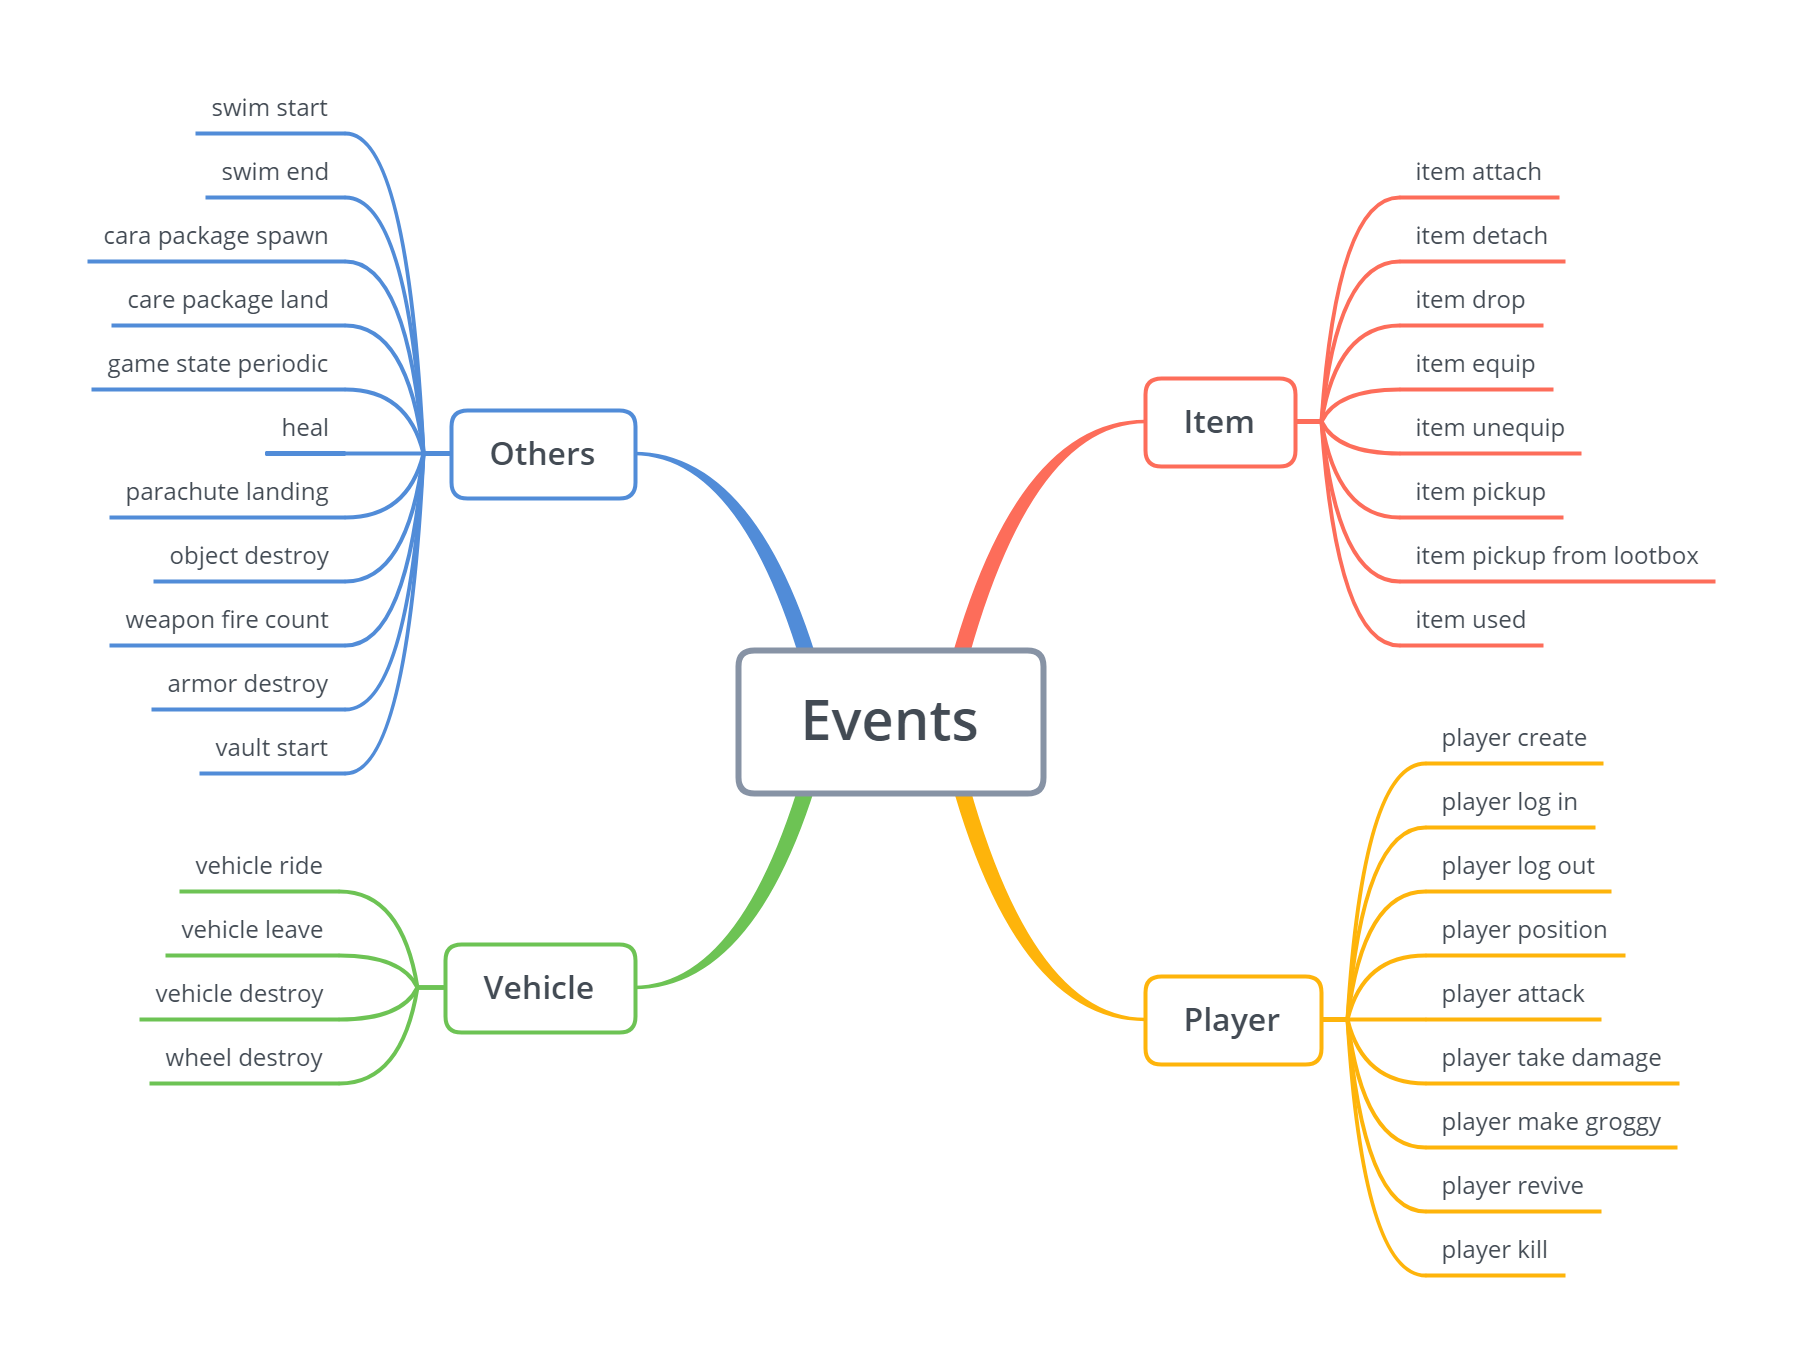
About the packets of events there are multiple events available on the API. There is a schema that contains the details on these events.
I scheduled a script to run every day on my EC2 instance that triggers the acquisition of new data from the sample and stores it in the right folder and in a daily folder.
To get the general information, the details on the match are collected (like the number of people, the map name etc.) to a DynamoDB table.
Some advice that I can give when you are storing the data:
- Store them as proper .gz files
- Be clear on the delimiter, escape char and quote char
- Drop the index
- For DynamoDB, convert your float data to Decimal
So that’s a simple overview about how I collected the data, now let’s have a look on the cloud part.
Crawl the data in S3 and DynamoDB with Glue (so much name dropping)
The AWS Glue setup dashboard is set up in two sections with the data catalog part and the ETL part (I will focus on the upper part of the dashboard).
Let’s focus on the data catalog first.
Data catalog and Crawler part
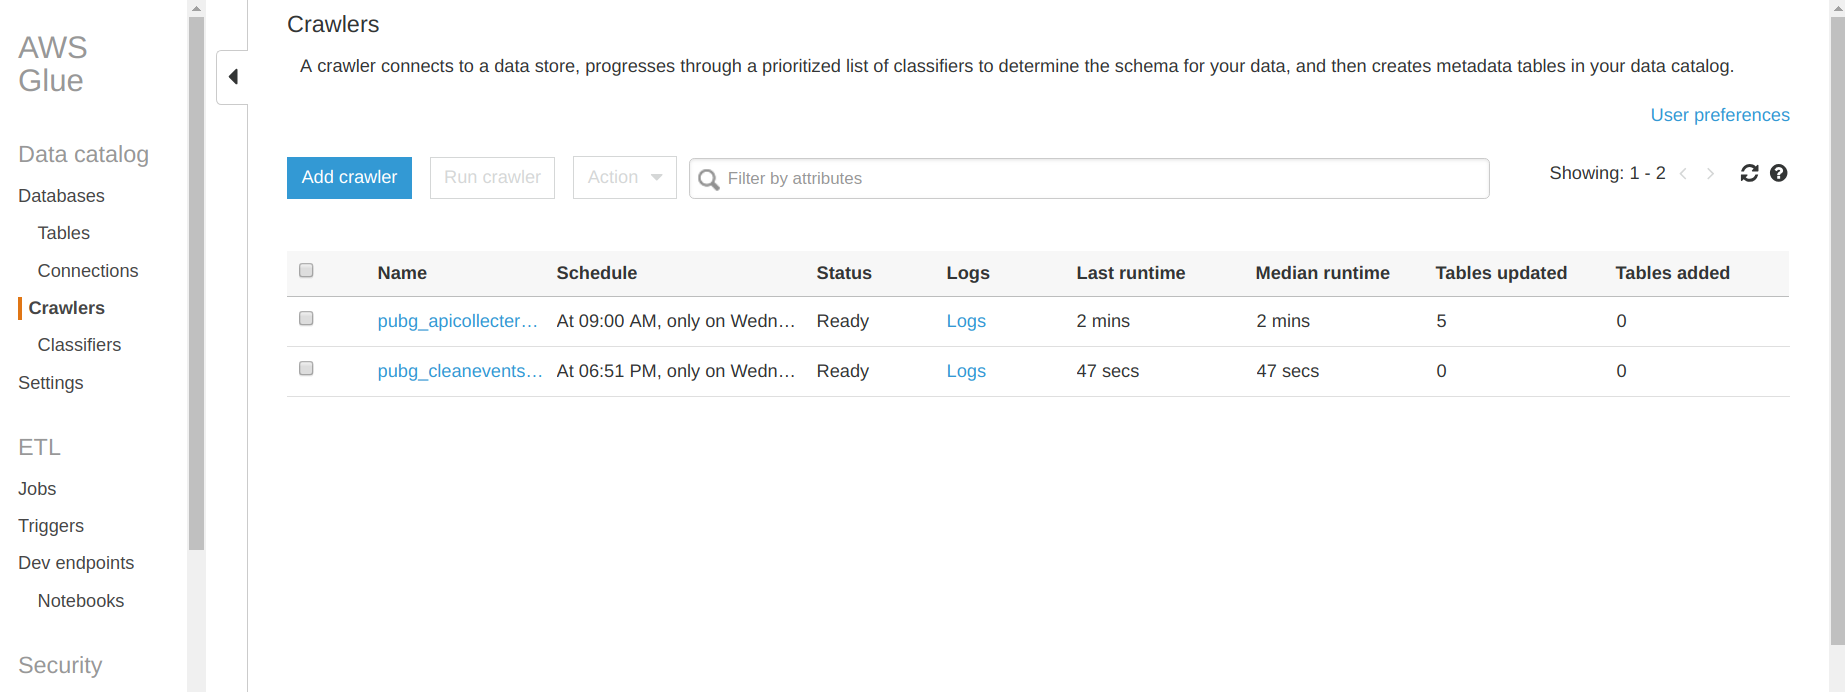
In this part you can find a database tab that contains all the databases and the tables associated that you created with Glue. For this project I created my first database. The interesting part is the crawler tab where you can set up the crawler that will navigate in S3, DynamoDB and some other services of AWS (like RDS). In the previous figure there is a list of all the crawlers that I created for this project. Let’s see what’s inside a crawler.
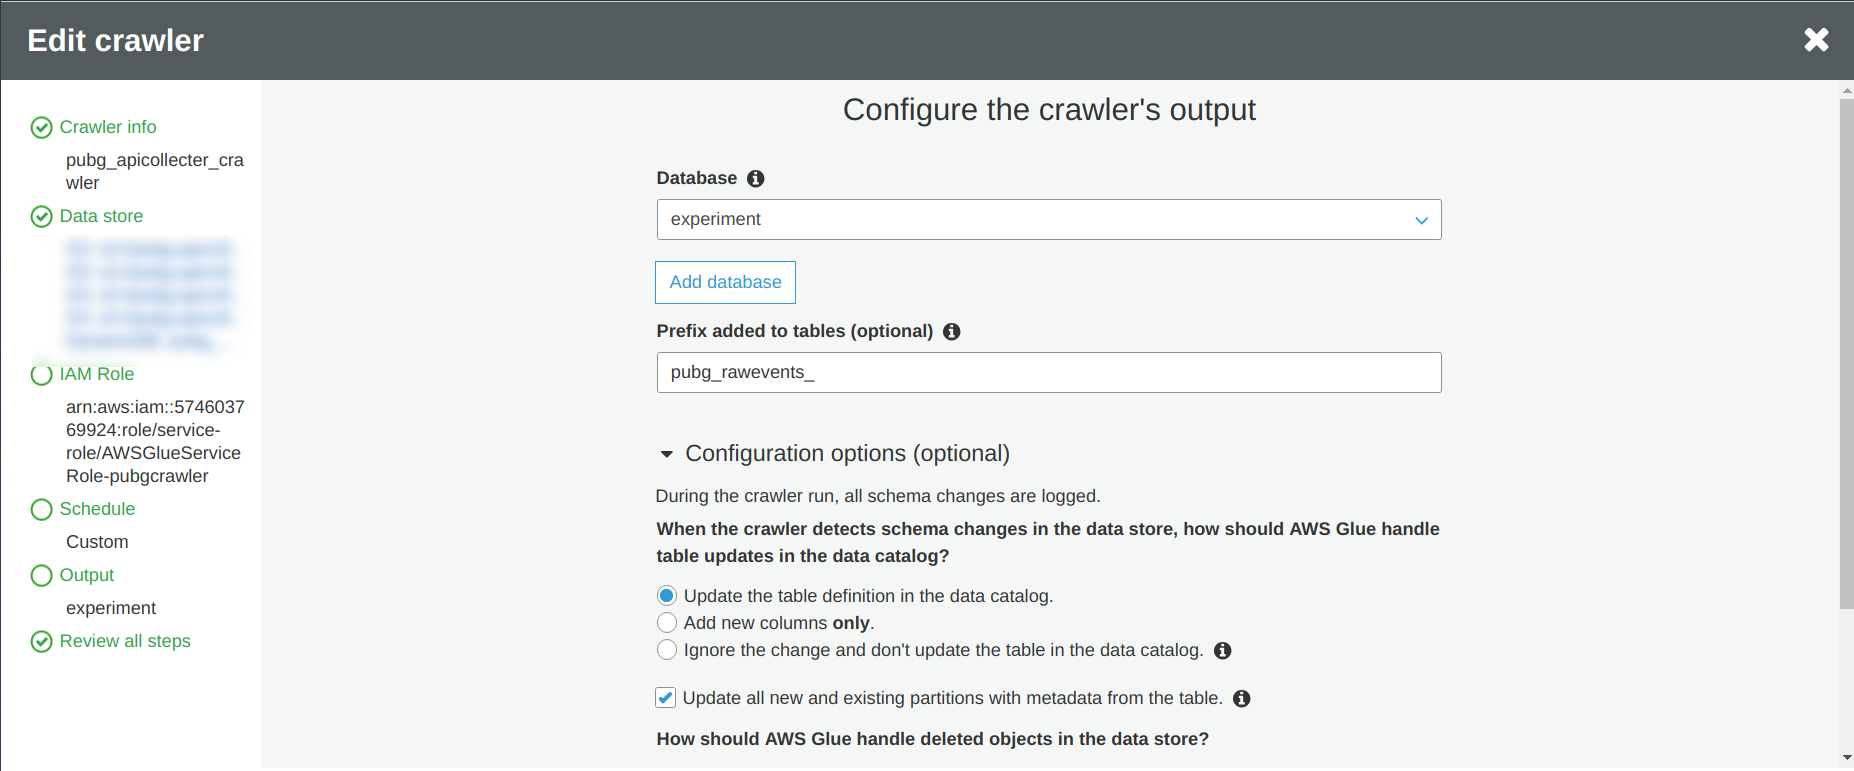
So when you set up your crawler, there is:
- Find a name for your crawler
- Define the data source, in this case I am going to focus on three events and my DynamoDB table
- Define an AWS role for your crawler to have access to all the data sources that you want to be crawled
- Define the frequency of execution of the crawler, I decided to make it run one time per week
- Define the output of the crawler
I am highly recommending to activate the checkbox “Update all new and existing partitions with metadata from the table” to avoid some partition issues during the reading of the data if you are not controlling what you are receiving like me.
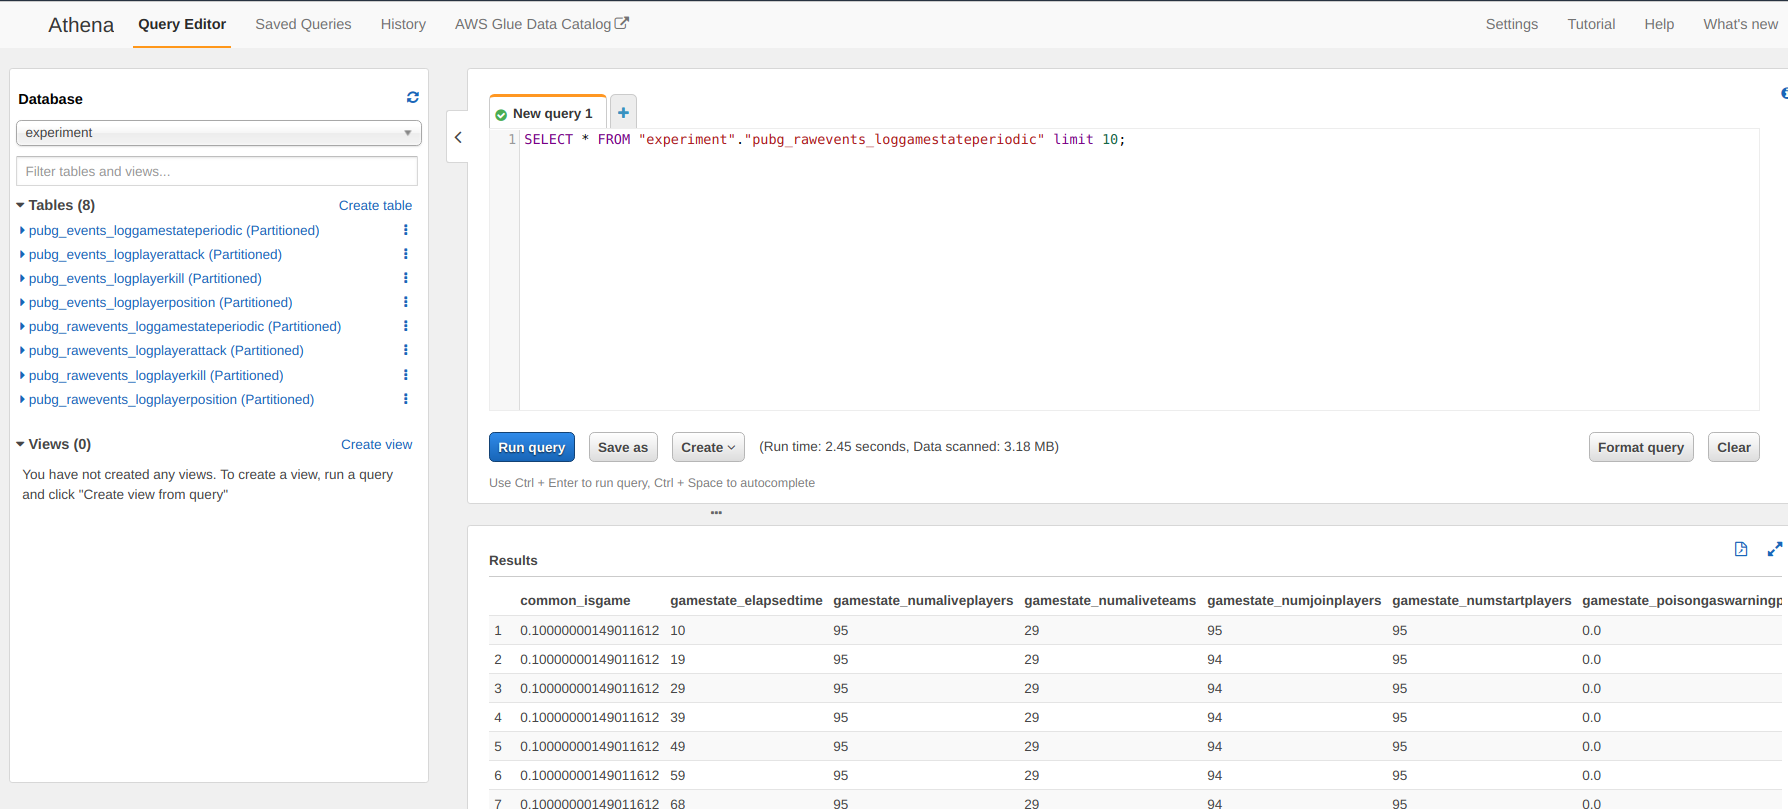
And voila, you just have to run the crawler from the main page of AWS Glue and you can now have access to your data extracted by the crawler in Athena (SQL way to access the data).
But the data is still quite raw so I decided to add a new layer to the crawler to make some data cleaning and add some information.
ETL part
For the ETL part, this is the data processing part of the pipeline. I could have analyzed the data as they arrived in the S3 bucket but I noticed that some of the records were not good (let’s say corrupted) so I wanted to apply a transformation state for this data to:
- Drop the corrupted records (with a wrong match ID format)
- Make a join with the details of the match collected in the DynamoDB table (and crawled previously)
- Calculate the delta time between the event and the beginning of the match (in seconds and minutes)
- Make some simple string manipulations as a function of the events (like cleaning the name of the weapon)
There is an illustration of the code and you can find the piece of code in the repository.
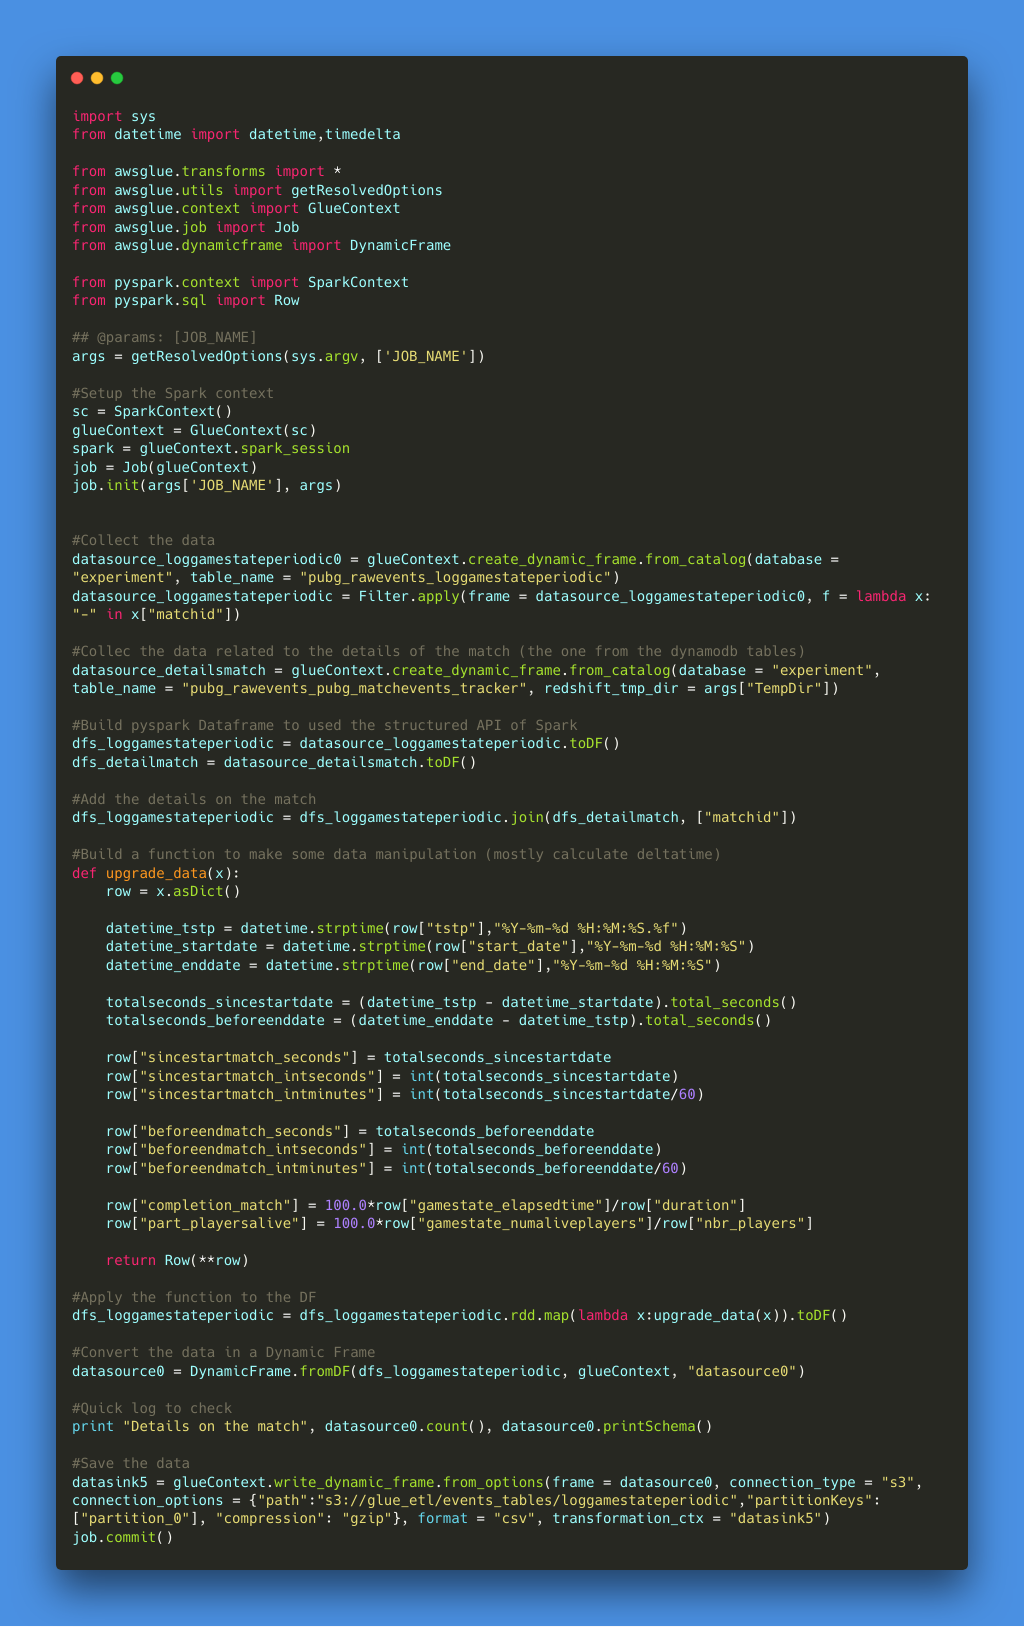
I tried the code approach but there is an option in the ETL configuration where you can have more of a diagram approach to make the data manipulation. As I wanted to use the RDD map and the dataframe of Spark I decided not to use this feature but I made some simple tests and it works fine. So now there is just a need to build a crawler to update the data catalog with the new data generated by the ETL part.
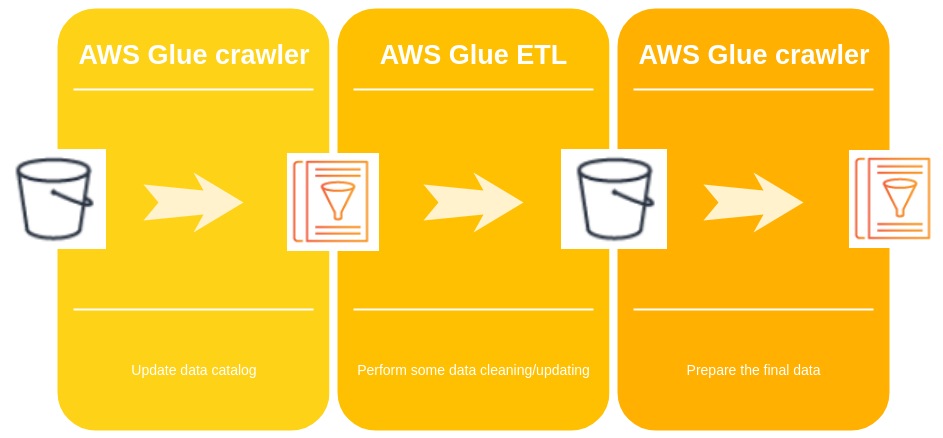
In the following schema there is the schedule of the operations in AWS Glue.
And now let’s make a quick test on AWS to request the process data from the web interface.
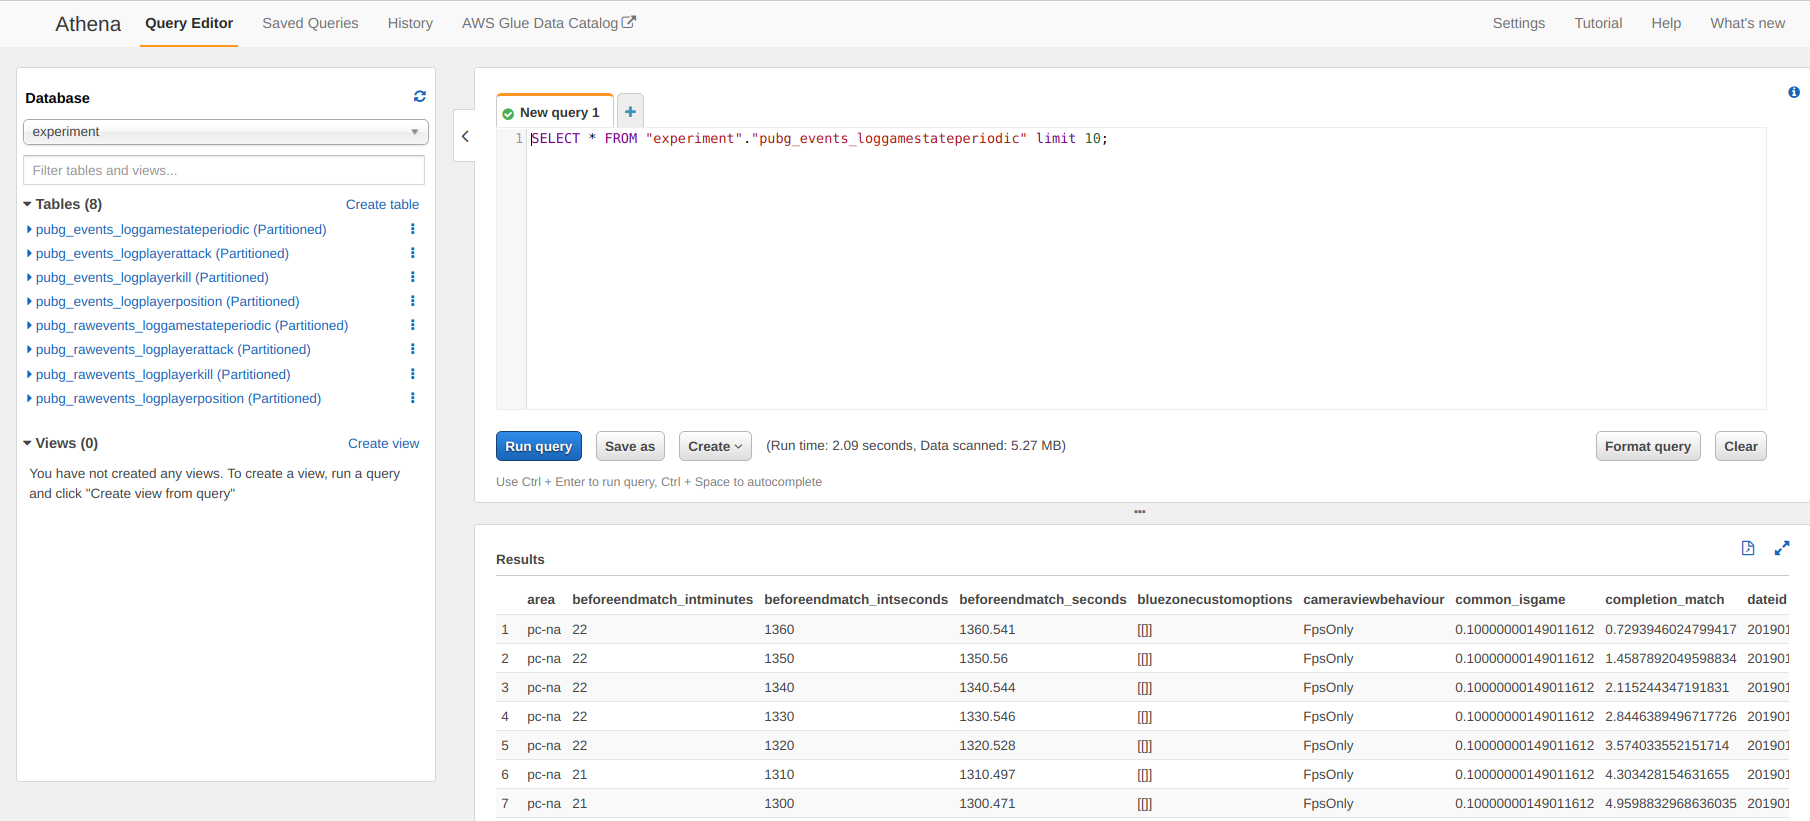
This data is accessible from Athena but you can connect AWS quicksight it have a more Tableau like experience (what I don’t like I am not a big fan of all these BI tool that are too blackbox for me) and more important you can access this data from a notebook (there is copy of a python environment in the repository).
That was a description of my data pipeline to collect the data from the PUBG API. The system is collecting around 1000 matches per day, it’s not a big amount but I wanted to start small.
And I am a nice guy, you can find an extract of the tables that I build for this project (it’s an extract of the data of the 27th January 2019) in this kaggle dataset.
I hope that you enjoy the reading, and if you have any comments don’t hesitate to comment.
References
- PUBG Kaggle competition — Kaggle
- PUBG Developer API — developer.playbattlegrounds.com
- PUBG sample endpoint documentation — documentation.playbattlegrounds.com
- PUBG matches endpoint documentation — documentation.playbattlegrounds.com
- pubg-datacollection repository — GitHub
- PUBG Events Kaggle dataset — Kaggle